
Five minutes performance report with Google Lighthouse
With little disappointment I realised today that I haven’t done a single post about performance testing (in almost 3 years of blogging!). Today I’d like to change that by introducing you with simple, yet powerful, performance tool called Lighthouse. According to developers:
Lighthouse analyzes web apps and web pages, collecting modern performance metrics and insights on developer best practices.
In case you are short on time choose Lighthouse. You only need… 5 minutes to make Desktop & Mobile report. Lighthouse opens Chrome browser and gathers all useful metrics from Chrome Dev Tools.
Setup
Installation couldn’t be easier. First you need npm (get it from here) and then type:
npm install -g lighthouse
Generating report
Now we need only two commands in order to get reports.
a) Desktop
lighthouse https://www.awesome-testing.com --disable-device-emulation --disable-cpu-throttling
--disable-network-throttling --view
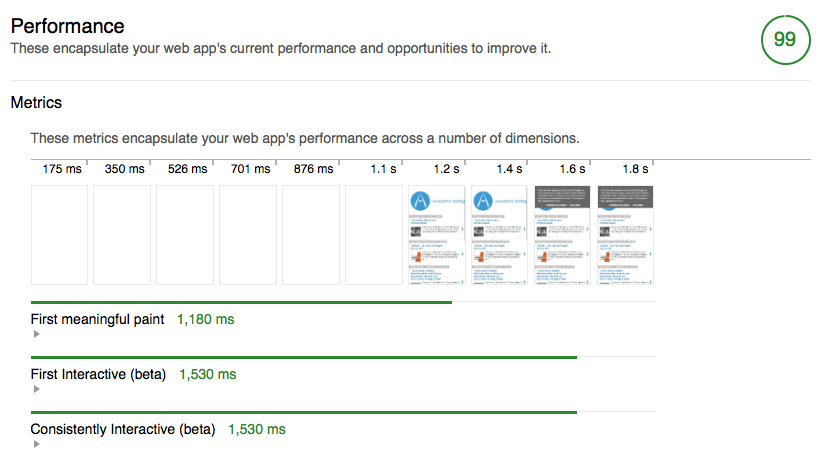
You can view generated reports here:
Link to Lighthouse Desktop report
b) Mobile
lighthouse https://www.awesome-testing.com --disable-network-throttling --view
You may want to get rid of --disable-network-throttling option in order to simulate 3G connection.
You can view generated reports here:
As you can see performance of my blog is really good :)
Useful options
a) Passing headers (can be used to get logged in pages)
lighthouse \--extra-headers "{\\"Cookie\\":\\"monster=blue\\"}"
b) Passing chrome flags
Every single one of Chromium Command Line Switches can be used
lighthouse \--chrome-flags=’--start-maximized’
Continuous Integration usage
As with almost everything related to automated tests we would like to add them into Continuous Integration. Lighthouse allows it! See official guide for details.
Quick win, isn’t it?
Tags: performance testing
Categories: Performance testing
Updated: