
Introduction
It seems like you really liked my latest post about console errors verification. Today I'd like to share another useful extension for your Selenium scripts - page load time measurements. Performance category is slightly underrepresented so far (only one post about Google Lighthouse) so it's a perfect opportunity to change it.
By the way since my last post about Lighthouse using this tool has become even easier. You can run it online on adedicated page. It also helps to optimize your page in SEO domain, for example by suggesting meta description.
Performance Timing interface
Two weeks ago I mentioned that w3c standardization regarding Selenium logging interface progresses rather slowly. This time the story is totally different. We have nicely documentedPerformanceTiming interfacewhich seems to be the implemented in every browser (I tested Chrome, Firefox, and Edge).
There's even an image which visualizes each metric:
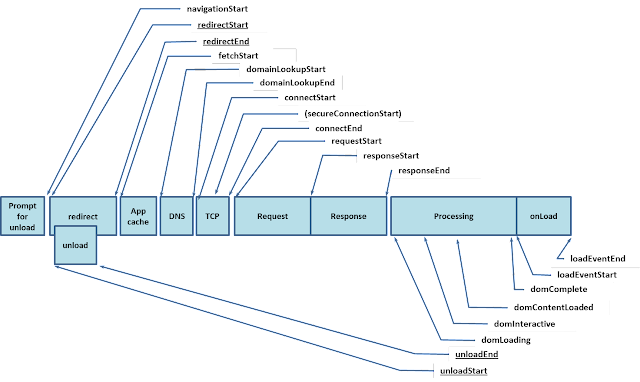
As you probably know deciding what to measure is crucial for effective performance testing so I suggest you to read it the standard carefully. For my demo I'll use only two metrics:
navigationStart - This attribute must return the time immediately after the user agent finishes prompting to unload the previous document. If there is no previous document, this attribute must return the same value as fetchStart.
loadEventEnd - This attribute must return the time when the load event of the current document is completed. It must return zero when the load event is not fired or is not completed.
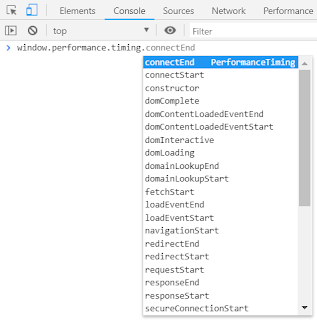
You can access each of those metrics via browser console. Just start typing window.performance.timing.
Demo
As usual, I'm going to FluentLeniumin my demo. It's Selenium extension with few additional features.
Let's use different browser this time - Microsoft Edge. Here is a simple driver setup.
    private static final String MY_EDGEDRIVER_PATH = "C:\\drivers\\MicrosoftWebDriver.exe";

    @Override
    public WebDriver newWebDriver() {
        System.setProperty("webdriver.edge.driver", MY_EDGEDRIVER_PATH);
        return new EdgeDriver();
    }
We may decide to measure different events at some points so let's make their setup easy and extendable in a separate PerformanceEvent enum.
public enum PerformanceEvent {

    LOAD_EVENT_END ("loadEventEnd"),
    NAVIGATION_START ("navigationStart");

    private final String event;

    PerformanceEvent(String event) {
        this.event = event;
    }

    @Override
    public String toString() {
        return this.event;
    }
}
So how do we access performance timing metrics in Selenium script? We only need to execute simple javascript and return its value (as long). Method gets PerformanceEvent enum value as a parameter.
    private long getEventValue(PerformanceEvent event) {
        String script = String.format("return window.performance.timing.%s;", event);
        return executeScript(script).getLongResult();
    }
Now let's move to the most interesting part for every tester - actual Junit implementation. We want to display loading time in seconds on screen and assert that it isn't greater than 3 seconds.
    @Test
    public void loadTimeTest() {
        goTo(awesomeTestingPage);
        long loadEventEnd = getEventValue(LOAD_EVENT_END);
        long navigationStart = getEventValue(NAVIGATION_START);

        assertThat(getLoadTimeInSeconds(loadEventEnd, navigationStart))
            .isLessThanOrEqualTo(3);
    }

    private long getLoadTimeInSeconds(long loadEventEnd, long navigationStart) {
        long loadTimeInSeconds = (loadEventEnd - navigationStart) / 1000;
        String logBody = String.format("Page Load Time is %s seconds.", loadTimeInSeconds);
        System.out.println(logBody);
        return loadTimeInSeconds;
    }
Pretty simple, isn't it? By the way, I checked it on Chrome and loading there is usually ~1 second faster than on Microsoft Edge.
Complete code with all imports, dependencies etc. is available on my GitHub project. Enjoy :)
Comments
Loading comments…