
Google has released a potentially significant tool for AI-driven web development and testing: an official Chrome DevTools MCP integration. In plain terms, Chrome DevTools can now hook into AI coding assistants via the Model Context Protocol (MCP).
Chrome DevTools MCP is a new MCP server that exposes Chrome's debugging and performance surface to AI assistants. Beyond the usual "click, navigate, inspect" flows (which are very similar to Playwright MCP), the standout feature is performance work: an agent can start a DevTools trace, capture Core Web Vitals (LCP, CLS, INP) signals (TBT is a lab proxy), and return concrete improvement suggestions—directly from a real Chrome session.
This post is a personal tour of what Chrome's MCP integration is, how it fits into the fast-evolving AI tooling space (as surveyed in my AI Tooling for Developers Landscape article), and—most importantly—the new workflows and use cases it unlocks for developers and testers.
What is MCP and Why Should We Care?
Before we get into Chrome DevTools MCP specifically, it helps to know what MCP (Model Context Protocol) is in general. Think of MCP as a sort of universal adapter for AI tools—Gergely Orosz calls it the "USB-C port of AI applications". It's an open standard (originally introduced by Anthropic in late 2024) that lets large language models (LLMs) connect to external tools and data sources in a structured way. For a deeper dive into MCP theory and implementation, check out my article on How Playwright MCP works. In other words, MCP defines how an AI can call out to a tool—whether it's a database, a browser, an OS command, you name it—and get results back.
flowchart TD
  A[AI Assistant] -->|Tool calls via MCP| B[MCP]
  B --> C[Chrome DevTools MCP]
  B --> E[Supabase MCP]
  B --> F[BigQuery MCP]
  B --> G[Other MCP Servers]

  %% Styling
  classDef hub fill:#f0f9ff,stroke:#0284c7,stroke-width:2px,rx:8,ry:8;
  classDef node fill:#ffffff,stroke:#94a3b8,rx:6,ry:6;
  classDef ai fill:#ecfdf5,stroke:#059669,stroke-width:2px,rx:8,ry:8;

  class A ai;
  class B hub;
  class C,D,E,F,G node;
MCP acts as a universal adapter between AI assistants and tool-specific servers.
flowchart
  subgraph After: Live connection
    A2[AI Assistant] --> B2[Chrome DevTools MCP]
    B2 --> C2[Chrome]
  end
  subgraph Before: Blindfolded
    X[AI Assistant] -. no live context .-> Y[(Browser)]
  end
This visual contrast shows how MCP removes the "blindfold" from AI assistants, giving them direct access to live browser state.
Under the hood, this builds on the idea of LLM function calling. Modern AI models like GPT-4, Claude, etc., can execute tools if those tools are defined in their environment. Traditionally, AI app developers had to hard-code a set of available tools (APIs for the AI) into their assistant. If you wanted your AI to do something new—say control a browser—you'd have to update the app with new functions. MCP flips that script. It allows AI assistants to dynamically discover and use tools from external MCP servers without the client app needing to know all the details upfront. The MCP server advertises what it can do (through a standardised handshake), and the AI can invoke those capabilities as needed. It's like plugging a new peripheral into your computer and having it instantly recognised—here the "peripheral" could be Chrome DevTools, and the "computer" is your AI agent.
Chrome DevTools MCP Tool Overview
Chrome DevTools MCP is essentially Chrome DevTools Protocol exposed as an MCP server. The Chrome DevTools team built a bridge that connects an AI agent to Chrome's debugging interface (the same low-level protocol that tools like Puppeteer or VS Code debugging use). Once connected, the AI can drive the browser and retrieve data via DevTools—all through standardised MCP calls. Google's announcement frames it nicely:
The Chrome DevTools MCP server brings the power of Chrome DevTools to AI coding assistants.
In practice, this means an AI can launch Chrome, open pages, click around, inspect elements, read console logs, record performance metrics—basically everything you and I do in DevTools, but automated.
Before diving into practical examples, let's explore the actual capabilities available in Chrome DevTools MCP. The integration provides 26 specific tools across 6 categories, giving AI assistants precise control over browser automation and debugging.
Here's the complete visual breakdown of available tools:
flowchart LR
  A[Chrome DevTools MCP]

  subgraph PF[Performance]
    PF1[performance_analyze_insight]
    PF2[performance_start_trace]
    PF3[performance_stop_trace]
  end

  subgraph IA[Input automation]
    IA1[click]
    IA2[drag]
    IA3[fill]
    IA4[fill_form]
    IA5[handle_dialog]
    IA6[hover]
    IA7[upload_file]
  end

  subgraph NA[Navigation automation]
    NA1[close_page]
    NA2[list_pages]
    NA3[navigate_page]
    NA4[navigate_page_history]
    NA5[new_page]
    NA6[select_page]
    NA7[wait_for]
  end

  subgraph EM[Emulation]
    EM1[emulate_cpu]
    EM2[emulate_network]
    EM3[resize_page]
  end

  subgraph NW[Network]
    NW1[get_network_request]
    NW2[list_network_requests]
  end

  subgraph DB[Debugging]
    DB1[evaluate_script]
    DB2[list_console_messages]
    DB3[take_screenshot]
    DB4[take_snapshot]
  end

  A --> PF
  A --> IA
  A --> NA
  A --> EM
  A --> NW
  A --> DB

  %% Optional subtle styling
  classDef hub fill:#f7f7ff,stroke:#6366f1,stroke-width:2px,rx:8,ry:8;
  classDef group fill:#f8fafc,stroke:#cbd5e1,rx:10,ry:10;
  classDef item fill:#ffffff,stroke:#94a3b8,rx:6,ry:6;

  class A hub;
  class PF,IA,NA,EM,NW,DB group;
  class IA1,IA2,IA3,IA4,IA5,IA6,IA7,NA1,NA2,NA3,NA4,NA5,NA6,NA7,EM1,EM2,EM3,PF1,PF2,PF3,NW1,NW2,DB1,DB2,DB3,DB4 item;
For the complete technical reference and detailed tool specifications, see the official Chrome DevTools MCP tool reference.
The server's tool surface evolves; the examples here reflect the documented set at the time of writing (no breakpoint/step APIs). Check the tool reference for updates.
The real power comes from how these tools work together. An AI agent can chain multiple operations: navigate to a page, wait for elements to load, inspect the DOM, check for errors, analyse performance, and even simulate user interactions—all while providing contextual insights based on the actual browser state.
Configuration is straightforward. It can be enabled by adding the following to your application:
{
  "mcpServers": {
    "chrome-devtools": {
      "command": "npx",
      "args": ["chrome-devtools-mcp@latest"]
    }
  }
}
Note that we are always using the latest version of the Chrome DevTools MCP server hence the number of tools may change over time. That's the actual benefit of MCP - we can use the latest server implementation without any updates on client side.
Playwright MCP vs Chrome DevTools MCP
Both Chrome DevTools MCP and Playwright MCP cover the basics of browser automation – page navigation, clicking, typing, form handling, script execution, console log access, screenshots, etc. These core capabilities overlap significantly. However, each tool has a different focus and feature set, which makes understanding their differences important for developers, testers, and AI tool builders when choosing the right tool for a given task.
| Dimension | Chrome DevTools MCP | Playwright MCP |
|---|---|---|
| Performance tooling | First-class performance profiling tools (e.g. performance_start_trace / performance_analyze_insight) for real-time Core Web Vitals trace analysis. | No built-in performance audit capability – can capture basic traces, but lacks on-the-fly Lighthouse-style analysis of metrics. |
| Test generation | No native test script generation feature (focuses on live analysis/debugging rather than producing code templates). | Highly effective for Playwright JS/TS tests due to the same underlying automation engine and dedicated tool browser_generate_playwright_test. |
| Network analysis | Detailed network request inspection via DevTools: includes list_network_requests (to list all requests) and get_network_request (to fetch detailed info for a specific request). This allows examining headers, status, payload, etc. for any request. | Exposes network logs through browser_network_requests (e.g. exportable as HAR) to review overall traffic. Lacks a fine-grained per-request query tool (the agent must parse a HAR or use logs for details). |
| Emulation capabilities | Can simulate different device conditions: emulate_cpu and emulate_network throttle the browser's CPU speed or network to mimic slow devices/connections. Useful for performance testing under stress. | No dedicated CPU/network throttling commands (no equivalent to DevTools' emulation tools). Instead, Playwright's strength lies in multi-browser coverage rather than device condition simulation. |
| Cross-browser support | Chrome-only (built on the Chrome DevTools Protocol and Puppeteer, it controls a Chromium-based browser exclusively). | Multi-browser and multi-platform: can drive Chromium, WebKit (Safari), and Firefox engines by specifying the browser type, enabling cross-browser testing from one framework. |
| DOM interaction model | Selector-driven: actions typically require explicit CSS/XPath selectors for target elements (e.g. fill({ selector: '#password', ... })). A special take_snapshot tool can generate a DOM snapshot with unique element IDs for the agent to reference if needed. | Accessibility-driven: automatically captures a structured DOM snapshot via the accessibility tree, allowing the agent to refer to elements by human-friendly descriptions (e.g. browser_type({ target: 'Password field', ... })) without specifying selectors. This makes natural-language element references possible out-of-the-box. |
| Debugging depth | Deep page introspection via DevTools Protocol: evaluate scripts, read console logs, screenshots, DOM snapshots. | No low-level code debugging; relies on logs, assertions, traces, and videos for post-run diagnosis. |
Shared Capabilities
Both MCP implementations handle fundamental UI automation tasks such as page loading, DOM queries, user input simulation, and state inspection in similar ways. An agent can navigate pages, click buttons, fill forms, execute JavaScript, and capture page state using either tool.
Strengths Breakdown
Chrome DevTools MCP strengths: This tool's unique power is in deep diagnostics – it offers unparalleled depth of analysis within Chrome by exposing the full Chrome DevTools Protocol to the AI. Its integrated performance tracing, precise device emulation, and programmatic debugging features make it ideal for tasks like performance tuning and complex debugging in the Chrome ecosystem.
Playwright MCP strengths: Playwright MCP excels in breadth of coverage and automation workflow. Built on a resilient cross-browser framework, it provides an AI assistant with the robust toolkit of a QA engineer. Standout features include its accessibility-based DOM model, the ability to auto-generate test scripts, rich tracing capabilities, and native support for Chromium, Firefox, and WebKit – all of which make it well-suited for validating functionality across browsers and maintaining comprehensive test suites.
Architectural Differences
Chrome DevTools MCP and Playwright MCP are rooted in different technologies, which leads to different philosophies. Chrome DevTools MCP is built by the Chrome team on top of the Chrome DevTools Protocol (CDP) and Puppeteer. In essence, it acts as an AI-driven extension of Chrome's developer tools – laser-focused on Chrome's capabilities for debugging and performance.
Playwright MCP, on the other hand, is built on Microsoft's Playwright framework, a multi-browser automation library. This means Playwright MCP is inherently polyglot: it can automate Chrome/Edge, Firefox, and Safari (WebKit) contexts, emphasising broad browser coverage and stable test automation over deep Chrome-specific introspection.
In practical terms, Chrome DevTools MCP prioritises depth in a single environment (Chrome). It gives an AI the same low-level control a developer would have in Chrome's DevTools – from inspecting network internals to profiling performance – making it a superior choice for diagnosing and investigating complex front-end issues within Chrome.
Playwright MCP prioritises breadth across different environments. Its design provides a consistent high-level API to drive any major browser, making it ideal for verifying user journeys and functionality in a cross-browser context.
Element Interaction Models
One notable difference stemming from these architectures is how each approach identifies and interacts with page elements.
Playwright MCP was built around an accessibility tree model – it automatically captures a structured snapshot of the DOM, allowing the AI to refer to elements in a human-friendly way by role or label (e.g. "Submit button" or "Password field") rather than by strict selectors.
Chrome DevTools MCP, by contrast, expects the AI to specify targets via explicit CSS or XPath selectors (e.g. using a selector #password to find a field) unless the agent takes an extra step to request a DOM snapshot for reference. The DevTools MCP does provide a take_snapshot tool that returns a text-based DOM with unique element identifiers, which an agent can use to map and interact with elements by ID. However, this is an explicit action.
Out of the box, DevTools MCP is closer to how a developer works (direct selectors), while Playwright MCP makes the AI's view of the page more semantic and high-level from the start.
Since DevTools MCP provides a more css selector-based model for interacting with elements (similar to cy.get('selector') or driver.findElement(By.cssSelector('selector'))), it may also be used to support UI automation in tools beyond Playwright, such as Cypress or Selenium. I haven’t yet confirmed this, so I’m keeping it in italics for now — but it could be a good idea for a future blog post.
Why Performance is the Unique Angle Here
While actions like navigation, DOM inspection, console checks and basic UI testing map closely to Playwright MCP, DevTools MCP goes further on performance: it exposes trace recording and analysis primitives (performance_start_trace, performance_stop_trace, performance_analyze_insight) so an agent can collect evidence and interpret it in one loop.
Lighthouse in Brief
Lighthouse is Google's automated auditing tool that runs lab checks for Performance, Accessibility, SEO and more. It measures Core Web Vitals like LCP (loading), CLS (visual stability), INP (Interaction to Next Paint) and uses TBT (Total Blocking Time) as a lab proxy for responsiveness. Traditionally we ran Lighthouse in DevTools, CI, or via PageSpeed Insights to get a score and a list of opportunities.
What Changes with DevTools MCP?
Instead of a one-off audit, you can orchestrate: record a DevTools trace, get insights, apply a code change, and re-trace—all inside the same agent session. This tight feedback loop moves performance work from "report then manually fix" to "investigate → change → re-measure" with the browser and agent in lock-step.
Performance-First Debugging with DevTools MCP
Use these prompt patterns to shift from generic checks to trace-driven performance work:
Automate a page-load trace
Start a performance trace for /path, reload, and analyse LCP, CLS, and TBT.
List the top main-thread long tasks and render-blocking resources,
mapping each to scripts or styles.
Explain which tasks most affect responsiveness (TBT) and propose concrete splits/defer.
Compare device/network profiles
Repeat the trace with mid-tier mobile CPU emulation and Slow 4G.
Summarise deltas in LCP and TBT, and point to the culprit scripts.
Actionable follow-ups
Suggest code-level changes to cut TBT by 30% (splits, defer, scheduler.postTask).
Then re-run the trace and show before/after numbers.
After the page is idle, simulate a realistic interaction (e.g. open menu, type in search).
Report any long tasks during interaction and suggest ways to lower input delay
(e.g. code-splitting handlers, yielding with scheduler APIs).
These are powered by DevTools MCP tools like performance_start_trace, performance_stop_trace, and performance_analyze_insight, plus standard navigation/DOM utilities when you need context.
Example: Live AI Agent Session
Me
Using Dev Tools MCP analyse the performance of http://localhost:8081/register page. Are there any suggestions how to improve it?
Cursor 1.6.42 + Sonnet 4.0 Session Excerpt
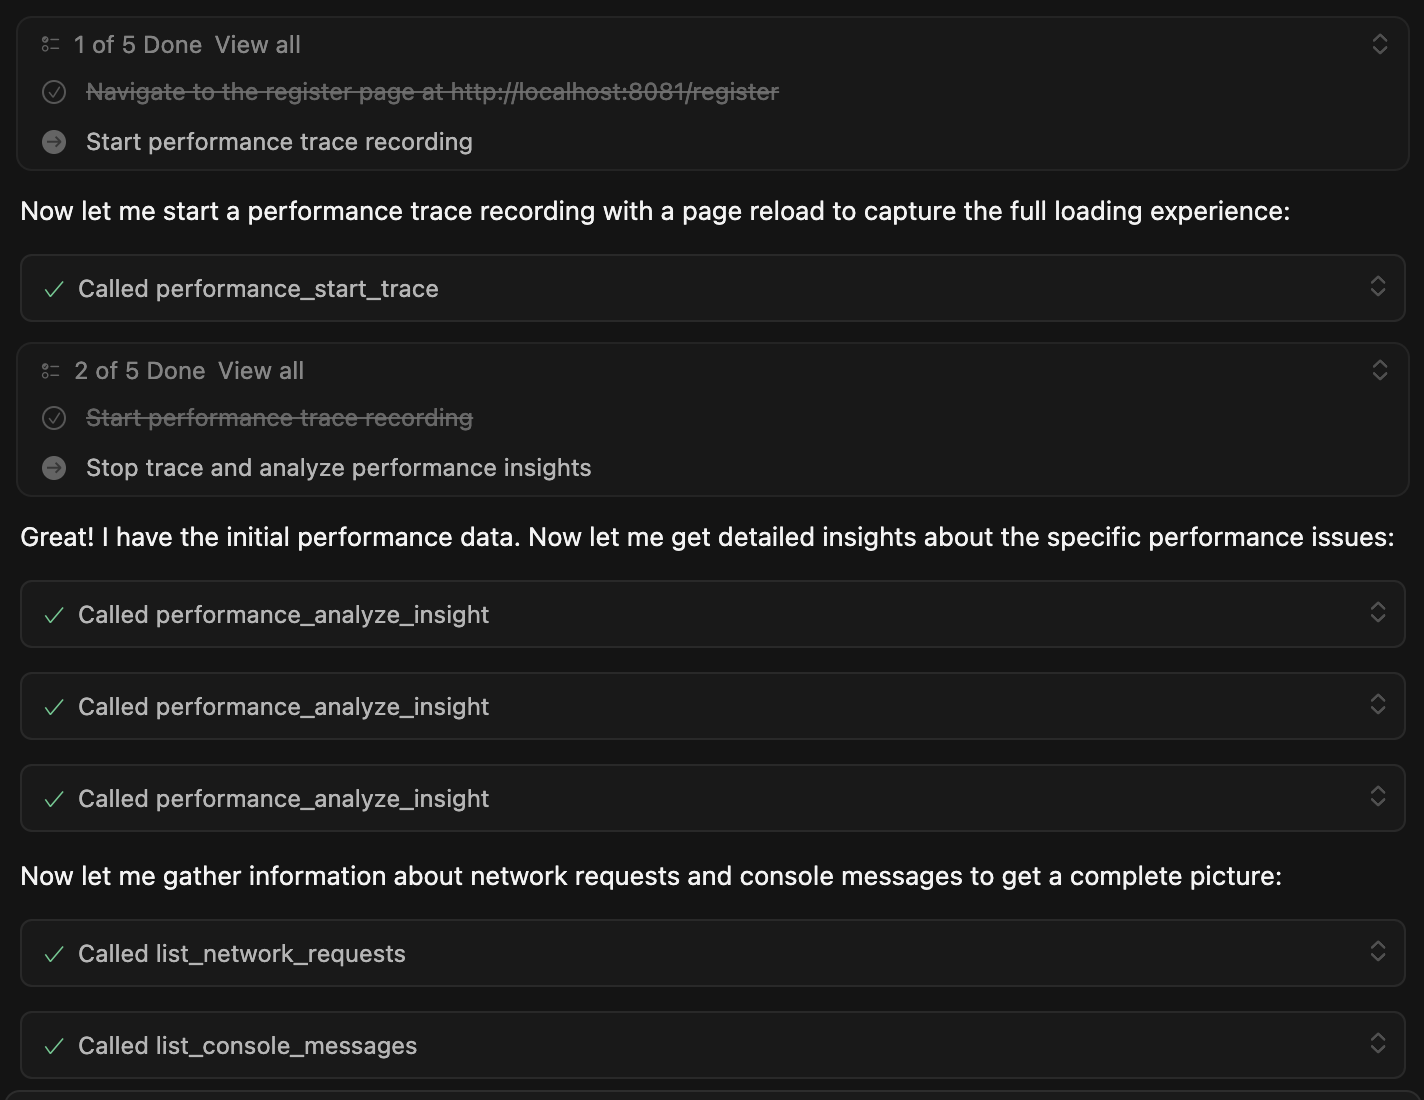
📊 Complete AI Performance Analysis Session (click to expand)
The AI assistant automatically navigated to the page, started performance tracing, analyzed the results, and provided detailed recommendations:
Performance Metrics Found:
- LCP: 271ms (good, under 2.5s threshold)
- CLS: 0.00 (excellent, no layout shifts)
- TTFB: 8ms (very fast server response)
Key Issues Identified:
- 97.2% of LCP time spent on render delay (264ms)
- CSS file
index-C3W9awP0.cssis render-blocking (77ms) - 45ms main thread processing time
- Missing
autocompleteattribute on password field
Top Recommendations:
- Optimize CSS delivery - preload critical styles, inline above-the-fold CSS
- Code splitting - lazy load non-critical components, use Scheduler API for heavy work
- Resource hints - add preconnect/preload for external resources
- Performance monitoring - implement Core Web Vitals tracking
// Example optimization suggested:
import { scheduler } from 'scheduler-polyfill';
await scheduler.yield(); // let rendering catch up
scheduler.postTask(() => heavyWork(), { priority: 'background' });
Assessment: Page performs reasonably well but has significant room for client-side rendering optimization. Main focus should be reducing the 97% render delay through CSS and JavaScript bundle improvements.
Unique Use Cases for Chrome DevTools MCP
Chrome DevTools MCP shines in scenarios that involve performance tuning and low-level debugging within Chrome. Some use cases where it's the superior tool include:
Performance analysis and optimisation: Recording and analysing real Chrome performance traces. An AI agent can use performance_start_trace and performance_analyze_insight to capture metrics like LCP, CLS, TBT and get actionable insights in one loop. This turns an AI into a performance engineer – identifying bottlenecks and suggesting fixes based on actual trace data from Chrome's Performance panel.
Emulating slow devices and networks: Simulating adverse conditions to test robustness. DevTools MCP can throttle CPU and network via emulate_cpu and emulate_network, making Chrome behave like a low-end mobile device or a slow 3G connection. This helps an AI agent observe how a site performs under strain (e.g. increased load times, main-thread jank) and pinpoint weaknesses.
Targeted network request inspection: Deep-diving into specific HTTP requests. Using get_network_request, an agent can retrieve detailed information for any resource (headers, status codes, payload, timing). This is invaluable for diagnosing issues like failing API calls, CORS errors, or large unoptimised assets, all directly through Chrome's network debugging interface.
Interactive debugging sessions: Performing live debugging steps as a developer would. The agent can execute custom JavaScript in the page context with evaluate_script, retrieve console output via list_console_messages, and even snapshot the DOM state with take_snapshot for offline analysis. This means the AI can inspect and manipulate the page on the fly – checking variables, reading error logs, or capturing the DOM at a point in time – enabling a conversational debugging experience.
Iterative performance fixing loops: Engaging in a Lighthouse-style measure → fix → re-measure cycle entirely within one session. For example, an agent might record a baseline trace, identify that a large JavaScript bundle is causing a long Total Blocking Time, then suggest code-splitting that bundle. The agent can apply the change (if integrated with a codebase or by instructing a developer), reload the page, and immediately collect a new trace to verify the improvement. DevTools MCP's tight integration (trace → suggest → tweak → trace again) enables this kind of iterative optimisation workflow that was previously manual and time-consuming.
Use Cases Better Suited for Playwright MCP
Playwright MCP comes into its own in scenarios focused on cross-browser validation and scalable test automation. It is often the better choice for:
Cross-browser functional testing: Ensuring a web application works correctly across all major browsers and platforms. With Playwright MCP, an AI can run the same test flow in Chromium, Firefox, and WebKit, catching browser-specific issues and ensuring a consistent user experience for all users. This breadth makes Playwright MCP invaluable for QA scenarios where coverage is key.
Generating end-to-end test scripts: Creating maintainable automated test cases from natural language descriptions or exploratory sessions. Playwright MCP provides the browser_generate_playwright_test tool to automatically generate Playwright test scripts based on actions the AI performs during a session. This allows an AI assistant to effectively become a test author – you can prompt it to "explore the login flow and produce a reusable test," and it will navigate through the flow, then output a ready-to-run TypeScript test script using Playwright's best practices (role-based locators, auto-retrying assertions). Chrome DevTools MCP currently has no equivalent capability.
Continuous integration and regression testing: Running suites of tests in CI/CD pipelines for ongoing validation. Playwright's robust and deterministic automation is designed for repeated execution, making it suitable for an AI to execute nightly regression tests or integrate into a DevOps workflow. Because Playwright MCP is built on the same engine as the Playwright testing framework, it can leverage features like parallel test execution and report generation, which are essential for large test suites. In contrast, DevTools MCP is more targeted for interactive debugging sessions than high-volume test runs.
Trace and video-assisted debugging: Diagnosing test failures using rich artifacts. Playwright's ecosystem supports a Trace Viewer and video recording out-of-the-box. An AI agent can run a scenario with tracing enabled (--trace) and have Playwright produce a complete trace log of the session, or record a video of the browser interactions (--record-video). These artifacts provide a timeline of actions, network events, screenshots, and console logs, which the AI (or a human) can review to pinpoint what went wrong. This is extremely helpful for complex test scenarios – the AI can generate a trace, analyze it, and even present the developer with a visual report of a failure. Such features are part of Playwright's tooling ecosystem and not present in DevTools MCP.
Conclusion
Chrome DevTools MCP and Playwright MCP are complementary tools rather than strictly competing ones. Each has a clear role: DevTools MCP offers unparalleled depth of analysis within Chrome's environment, effectively letting your AI agent act like a developer with Chrome DevTools – ideal for diagnosing, debugging, and optimizing complex front-end issues in a live Chrome context. Playwright MCP offers superior breadth across different browsers and workflows, enabling an AI agent to behave like a QA engineer using an automation framework – perfect for validating functionality, generating tests, and ensuring cross-browser consistency.
A simple rule-of-thumb emerges: choose Chrome DevTools MCP when you need your AI to think and act like a developer debugging a problem in Chrome's inspector, and choose Playwright MCP when you need your AI to act like a tester or QA engineer exercising an app's features across browsers. In many cases, teams may even use both tools in tandem. For example, an AI assistant could leverage DevTools MCP to pinpoint and fix a performance issue in the Chrome version of an app, then switch to Playwright MCP to run a battery of cross-browser tests ensuring the fix holds on Firefox and Safari as well. In complex workflows, using the right tool for each job – or chaining them – allows the AI to maximize effectiveness.
Ultimately, as the MCP ecosystem evolves, these two platforms represent two powerful but complementary paths toward AI-assisted web development and testing. Chrome DevTools MCP will likely continue expanding its specialised debugging and performance toolkit in the Chrome ecosystem, while Playwright MCP will keep enhancing its automation suite for broad regression coverage. By understanding their differences and strengths, developers and testers can strategically harness both – using the deep-diving Chrome DevTools MCP when a problem calls for surgical investigation, and the wide-ranging Playwright MCP when the goal is comprehensive, automated verification across environments. Each plays a distinct role, and together they significantly broaden what's possible with AI-driven web tooling.
Comments
Loading comments…